

EQUITY MAPPING: YOUNG CHILDREN & NATURE
 The research is clear: When young children, ages 0 – 5, have regular access to nature and green spaces where they live, play and learn, their physical and mental health improves, they develop social-emotional skills and they are better prepared for school. This is why so many cities and agencies engaged in the Cities Connecting Children to Nature (CCCN) Initiative focus on a variety of pathways that enhance opportunities for young children, particularly those from communities of color, to engage with nature. CCCN’s Early Childhood Nature Connection Toolkit reflects many of those efforts.
Yet, before cities begin to implement these pathways, they must start by answering a basic question: Where do the young children who have the least access to nature live, play, and receive care? A growing number of CCCN cities use equity mapping to answer this question.
 Nature equity maps depict how natural green space appears in a city relative to key demographic, economic, and social vulnerability data. CCCN cities use these maps to prioritize park and natural spaces programming, renovation and acquisition projects, inform city plans, apply for funding, and develop public-facing messages to promote greater access to nature for young children.
The experience of CCCN cities points to some key steps involved in an equity mapping process focused on understanding young children’s current access to nature and informing policy decisions. Many more cities can use these same steps to understand and act to resolve disparities in access to nature for children of other ages, or all children. The process begins by assembling the right partners, accessing local data, and utilizing existing expertise. Below are steps to help along the way.
Consider who will coordinate and who to engage in the early childhood nature equity mapping project.
One of the first steps is to determine what department or organization will lead the equity mapping efforts. Parks and Recreation departments often lead these efforts. But, other possible leads include a United Way, a Chamber of Commerce, or community-based organization.
The project leads take on a number of critical roles, including:
- Framing the goals of the mapping project,
- Ensuring the right partners are involved,
- Engaging Geographic Information Systems (GIS) expertise,
- Coordinating and following through to make sure that maps reach city leaders and that they inform decisions connected to young children.
Gathering data can, and should, come from a number of different agencies and organizations. Cities will want to identify what data will be most useful to the mapping efforts and develop partnerships with agencies or organizations that hold that data. Partners will provide data to enhance maps.
Examples of partners that cities can collaborate with for data include:
- City planning departments or GIS consultants to develop maps,
- Other city departments for local socio-economic data,
- School districts,
- City, county or state early childhood agencies and childcare resource and referral agencies for information about early childhood programs in the city.
Many cities tap into nearby universities or students to support in data collection, such as park observation data among other data collection.
Determine what you want to achieve and who you want to reach.
It is important to think through and articulate the types of decisions and changes cities want to see. The equity maps should help inform the knowledge to make these decisions. For example, cities can use nature equity mapping to identify where vulnerable young children have inequitable access to green space.
This understanding guides decisions about:
- where to prioritize green space development and/or renovations,
- where to add nature programming with the potential to reach more young children, and
- where to add park design features for young children.
This type of information can help inform decisions of where to invest in early childhood nature connections because it provides clear illustrations of where there are nature gaps and heavy concentrations of young children.
Information about audiences will guide choices about which data are most important to map and how to best present the equity maps. For many cities, the primary audiences are city decision-makers and partners within the early childhood space.
Potential audiences for these maps include:
- City leadership
- Additional city departments
- Funders
- Policy makers
- School districts or school leadership
- Community organizations and partners
- Early childhood providers, agencies, and coalitions
- City residents and/or the public
Many cities decide that static maps are the best format for city leadership or partners since it presents the data in a straightforward manner. However, other cities use interactive maps for the public since they want the public to understand the various locations of green spaces in the city.
Identify and collect data about where young children in your city live and spend their days.
Examples of the type of data that cities can map with regards to early childhood include:
- the proportion of children under age 5,
- the proportion of non-white residents,
- the proportion of households with young children in poverty, and
- the proportion of households with children without a vehicle.
Much of these data can come from the 2020 Census and the American Community Survey available through the US Census Bureau.
City departments may have access to more localized data, such as receipt of public benefits or housing patterns. Generally, data at a smaller geographic level better depicts differences within a city. Local data tends to be more granular and specific. Whereas cities may find data from national sources (such as the Census Bureau) more readily available, it is less reliable at the local or block levels.
Cities will want to have a good understanding of where young children spend most of their time when they are outside of their homes. This data can come from organizations such as Childcare Aware of America’s Child Care Resource and Referral Agency. Regional, county or state childcare initiatives can provide information about the location and enrollment in early childhood programs. Cities can also collect these data through surveys and direct outreach to early childhood programs. Surveys are helpful in understanding the quality of programming.
Through these partners, cities can obtain information on the location, populations served, and enrollment levels of licensed childcare centers in the city.
Identify and collect data about green spaces in your city.
Geospatial data about green and nature spaces in a city includes information about parks, natural areas, wildlife corridors, playgrounds, greenways, trails, nature access, park quality, tree canopy, and urban heat islands, among others. Cities may also map publicly accessible school playgrounds depending upon the availability of nature in those sites. In many cities, planning, parks, public works departments, and school districts will already have geospatial map layers available.
Understanding park conditions and whether parks have amenities for young children and their families, such as infant swings, pathways for strollers, and family restrooms, can help to build out the full picture of nature access for young children and their families. Cities may already have some of this information available; in other cases, this might need to be collected through observation. Some cities rely on student support from local universities to collect this observation data.
Develop the maps with a variety of overlays.
Now is the time to put all the data together. This is where it is critical to have a partner with GIS experience who can overlay the data about young children with green space data. GIS is short for geographic information system which is a system that visually pulls all types of data together into a map format. Expertise in GIS mapping is extremely helpful in pulling all the data together.
Map refinements can include shading and color to show differences in demographic and socio-cultural data across the geographic area. Cities can produce several maps that tell the story of green space access for young children from several different perspectives.
Consider adding visual cues to make it easier for audiences to see disparities as well as opportunities for improvement across the city. For instance, dots can show the location of early childhood programs and circles can show a walkable radius from parks, childcare centers, or schools.
Each map needs to include a title, a legend to explain symbols, and scale bars to show thresholds across the data. In addition, citing data sources in some way gives the map credibility and serves as a starting point for subsequent updates.
Look for patterns and anomalies to tell the story of young children’s nature access in your city. These patterns or gaps can help inform decisions about where to increase nature access.
Cities can use the nature equity maps to understand where young children in the city live relative to existing green space. Mapping early childhood program locations also examines access to parks from these programs. Data about the quality of these spaces provides additional insight into current disparities.
Cities are using these maps to guide decisions about green space development and renovation, where to enhance nature programming for young children, and possible joint use agreements with schools.
Key questions to ask include:
- Where do the most vulnerable children in the city live?
- Where is the green space relative to these children?
- Where is the green space relative to early childhood programs across the city?
- What is the quality of the green spaces in locations across the city?
For city decision-makers, static maps often prove powerful and bring relevant data together in a user-friendly way. The use of ArcGIS Storymaps promotes further engagement for broader audiences.
Many CCCN cities used GIS mapping and data analysis to help inform local plans to implement early childhood nature connection pathways and determine priority populations. The GIS maps provide visual depictions of data to inform the development of the local strategy to improve young children’s equitable access to nature.
Below are five case studies of CCCN cities. They include four cities that received coaching and facilitated cross-city connections from the national CCCN team between November 2022 and August 2023. These are the cities of Imperial Beach, CA; Prescott, AZ; Boulder, CO; and Batesville, AR. The fifth city is San Francisco, also a CCCN city, which previously conducted a similar equity mapping process years prior.
Imperial Beach, CA
Population: 25,791
Lead Partners: Imperial Beach Parks, Recreation, and Community Services Department
Goal of Mapping:
The Parks, Recreation, and Community Services department worked with a contractor to compile and map city indicators focused on young children and available green space in order to identify needs and inequities across the city.
How the Project will Inform Policy and Funding Decisions:
- The City plans to create a StoryMap using ArcGIS to place on Parks and Recreation website page
- Use the maps to make the case for a joint use agreement between parks and schools to have a green schoolyard
- Share the maps with other city departments on finding space to create new parks
- Continue mobile recreation outreach and partnerships to bring nature to the youth five and under in Imperial Beach
- Increase outreach to the areas of city that do not have parks to engage them with nature activities
Steps to Success:
The Parks, Recreation, and Community Services department used a $10,000 CCCN grant to hire a contractor to compile and map city indicators focused on young children and available green space in order to identify needs and inequities across the city.
The City mapped:
- city parks along with amenities
- childcare centers including home based for youth five and under
- schools and green spaces
- Determined areas of city that are under parked
The City created multiple maps for:
- children under five years old,
- children under eighteen years of ages,
- 10-minute walkability radius,
- heat maps,
- low income households with under five and eighteen,
- household vehicle status.
Under age 5, 10-min walk
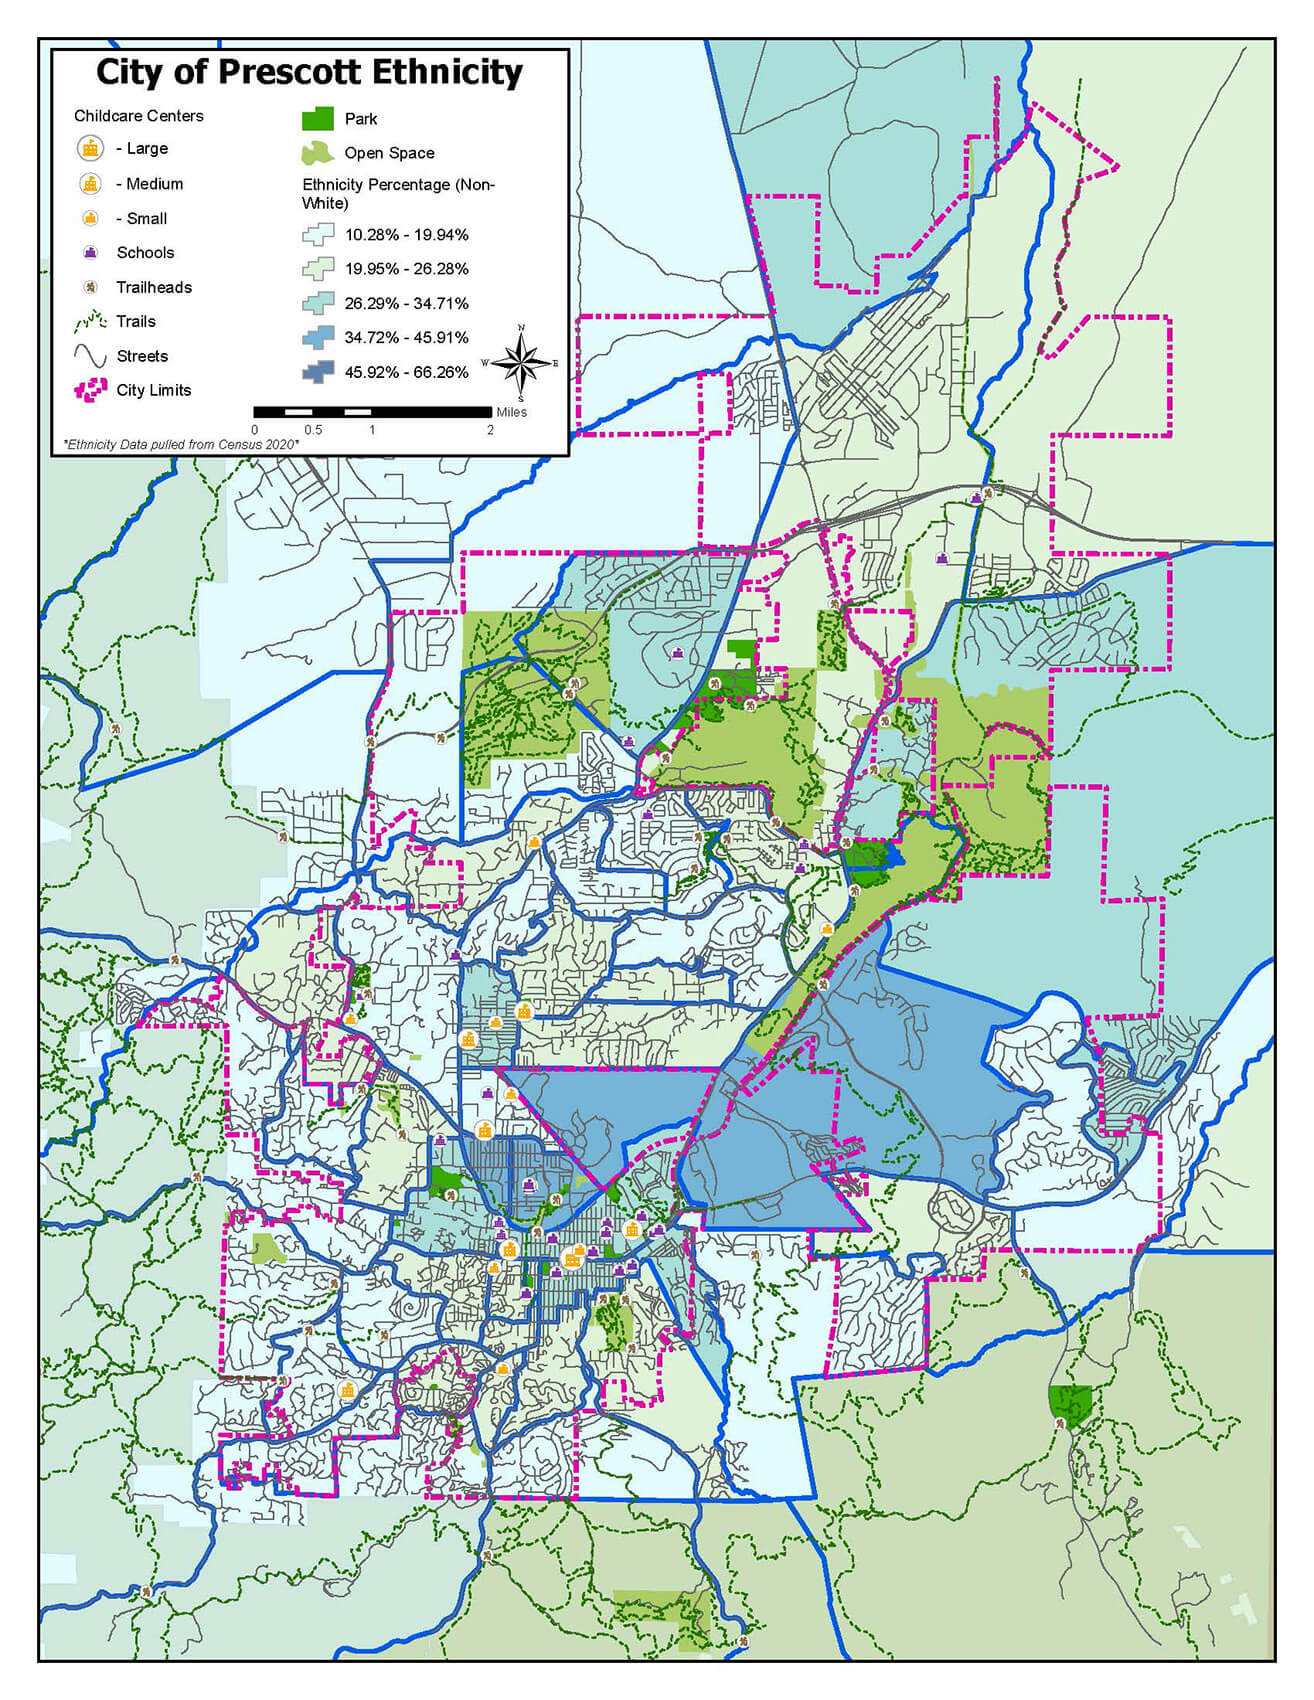
Race/Ethnicity
Under age 18, 10-min walk
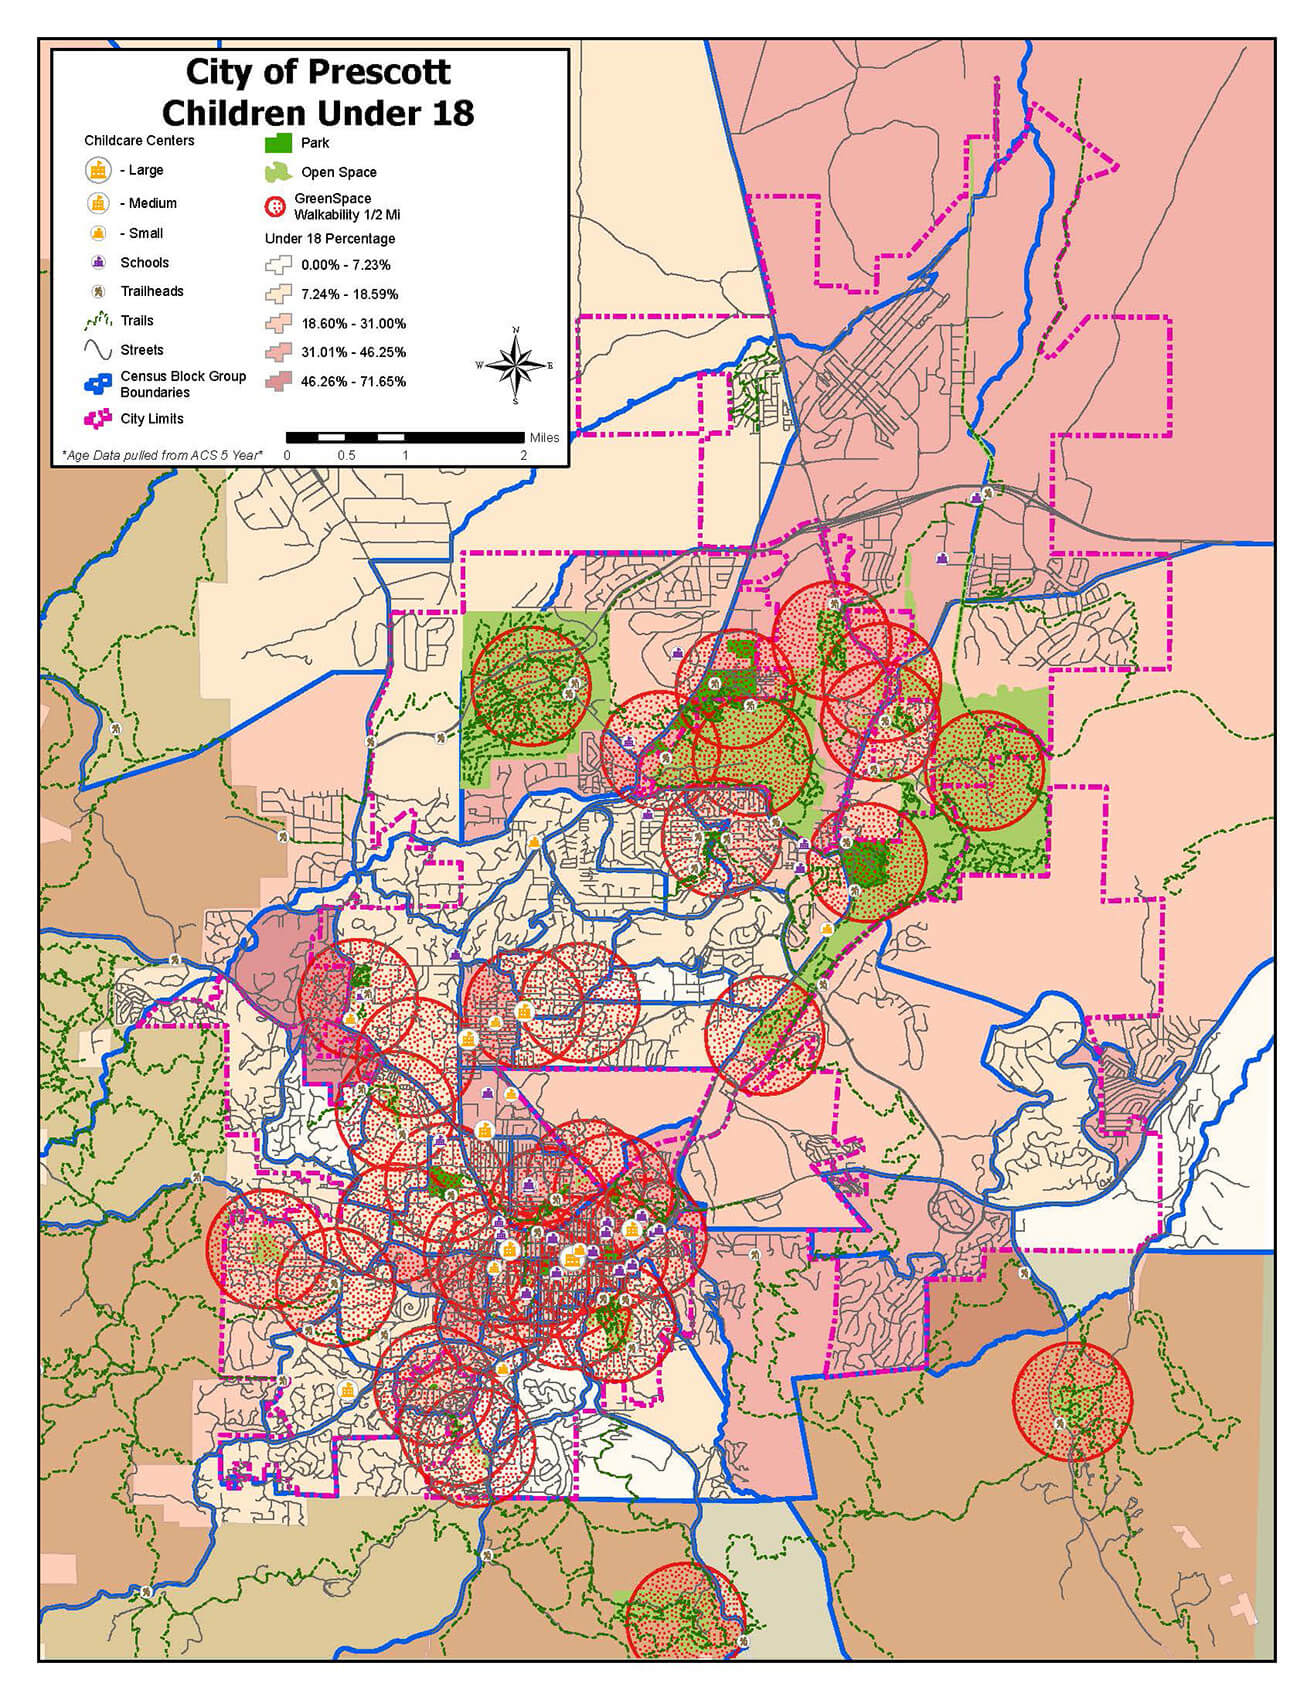
Prescott, Arizona
Population: 45,907
Lead Partners: Prescott Parks and Recreation Department, GIS Department, Yavapai County Community Health Services, University of Arizona Cooperative Extension Agency, Arizona Serve
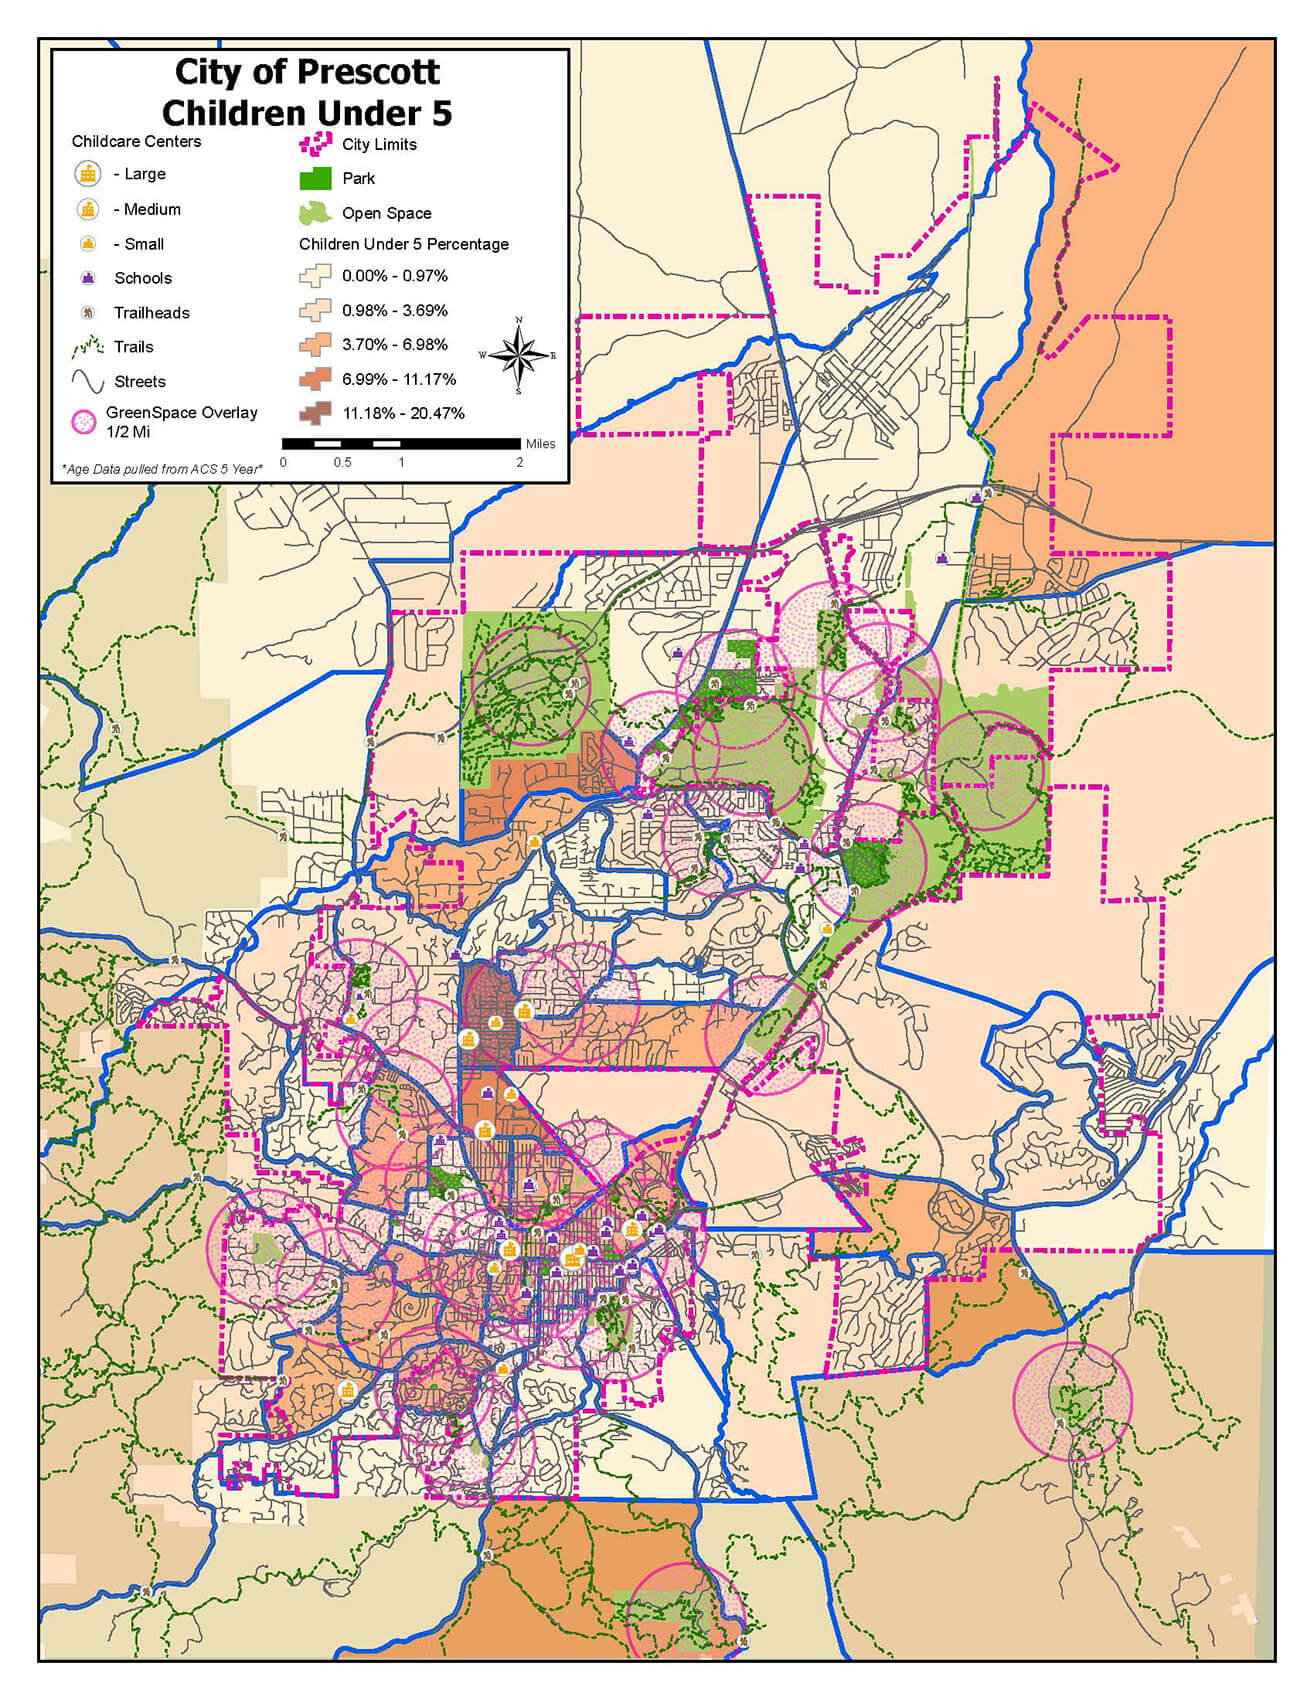
Goal of Mapping: The City of Prescott team compiled and mapped up-to-date data about young children and green space in order to identify needs and inequities across the city.
How the Project will Inform Policy and Funding Decisions:
The city team has started to share the GIS findings with city leaders and other key city departments and has the following items planned:
- Inform the 15-year General Plan, currently under development
- Inform the City’s first Recreation Department Plan and local Community Development Block Grant (CDBG) funding priorities.
- Leverage partner funding (University of Arizona) to assess greenspaces on ECE schools or childcare centers and to plan ways to address the findings.
- Conduct a similar analysis with Prescott Valley (neighboring city)
- Partner with First Things First, Arizona’s Early Childhood Agency, to conduct a similar analysis regionally
- Launch a caregiver leadership group in conjunction with the free early childhood park nature play/caregiver education program, Nature Niños Prescott to inform the early childhood & greenspace decision making process
Steps to Success:
The project had two components: identifying, collecting, and mapping up-to-date data on a set of core indicators that reflect where young children in the city, particularly those who are low income and of color, live and spend their time; And 2) collecting observational data about existing green space and features that increase or decrease young children’s and their families’ access to those greenspaces.
The City developed a Survey123 tool to map and assess greenspace features and quality in relation to suitability for children ages 0-8 and their caregivers. The tool included looking at indicators like sidewalk and stroller access, changing tables in restrooms, phone service, shade, lighting, and play equipment for ages 0-5.
The City used Survey123 results, municipal Lucity (GIS) data, 2020 Census (block group & some block census) data, First Things First (the state ECE agency) data, to create different maps.
The City produced maps including: Greenspace overlaid with the following: Children Under 5, Children Under 18, 10-minute Walkability Radius, Low Income Households, Household Vehicle Status, Ethnicity/Race, Sidewalks & Trails as well as a Children’s Green Space Accessibility & Quality Heat Map
A high level conceptual of our Reimagined Riverside Park in the heart of the city including Nature Discovery and Nature Play in respective areas.Photo credit: Bastesville Chamber of Commerce.
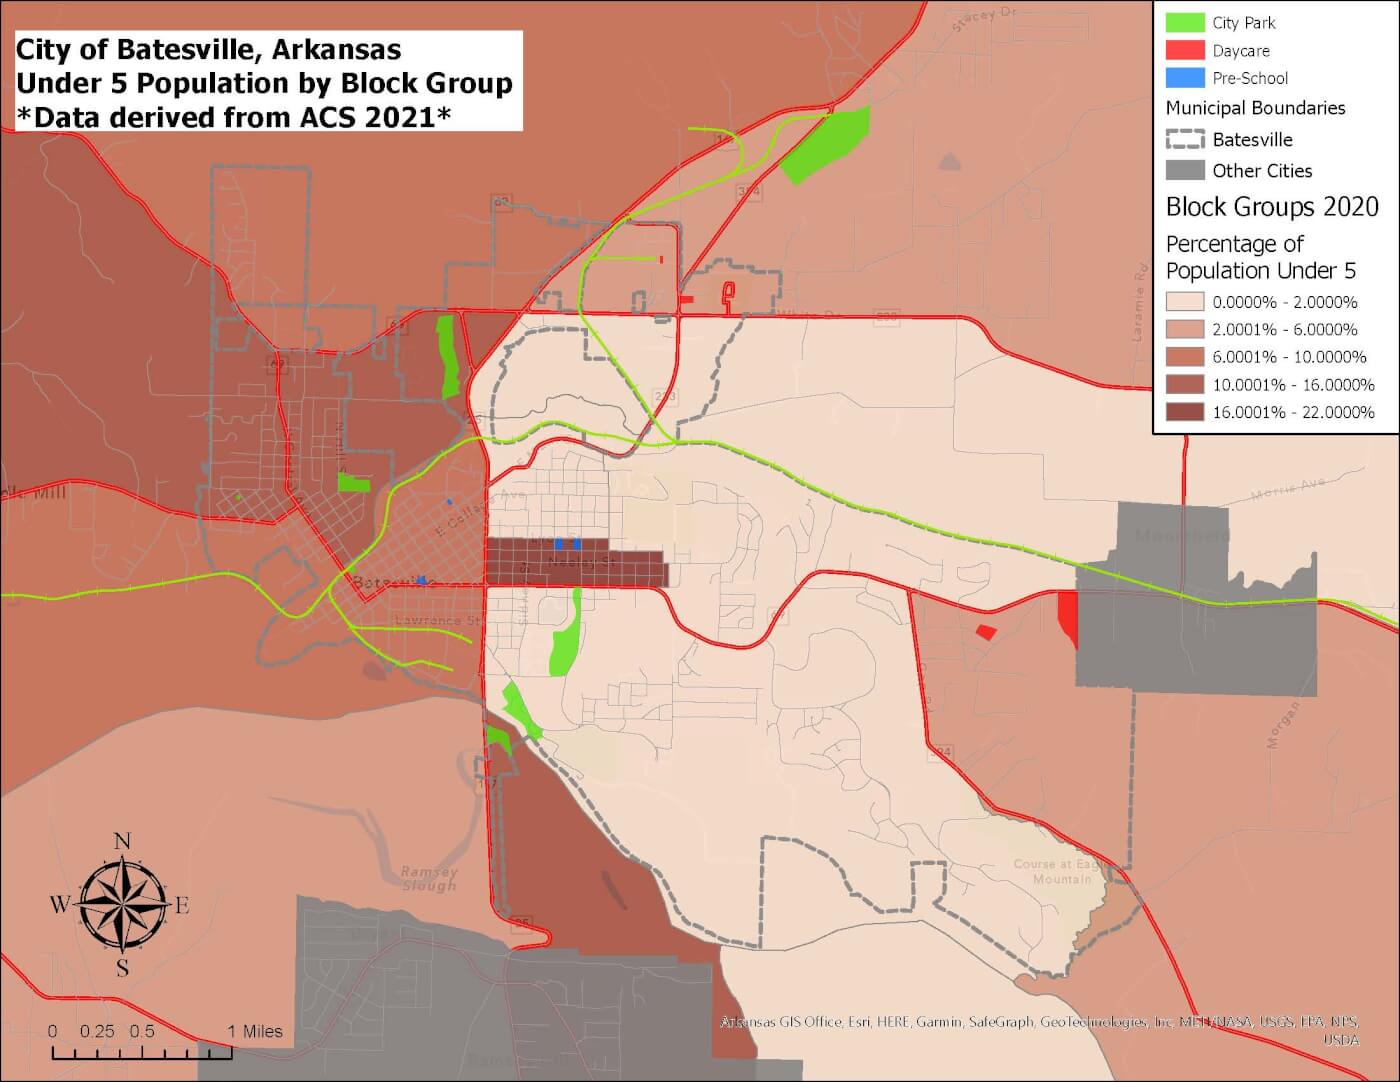
Children Under 5
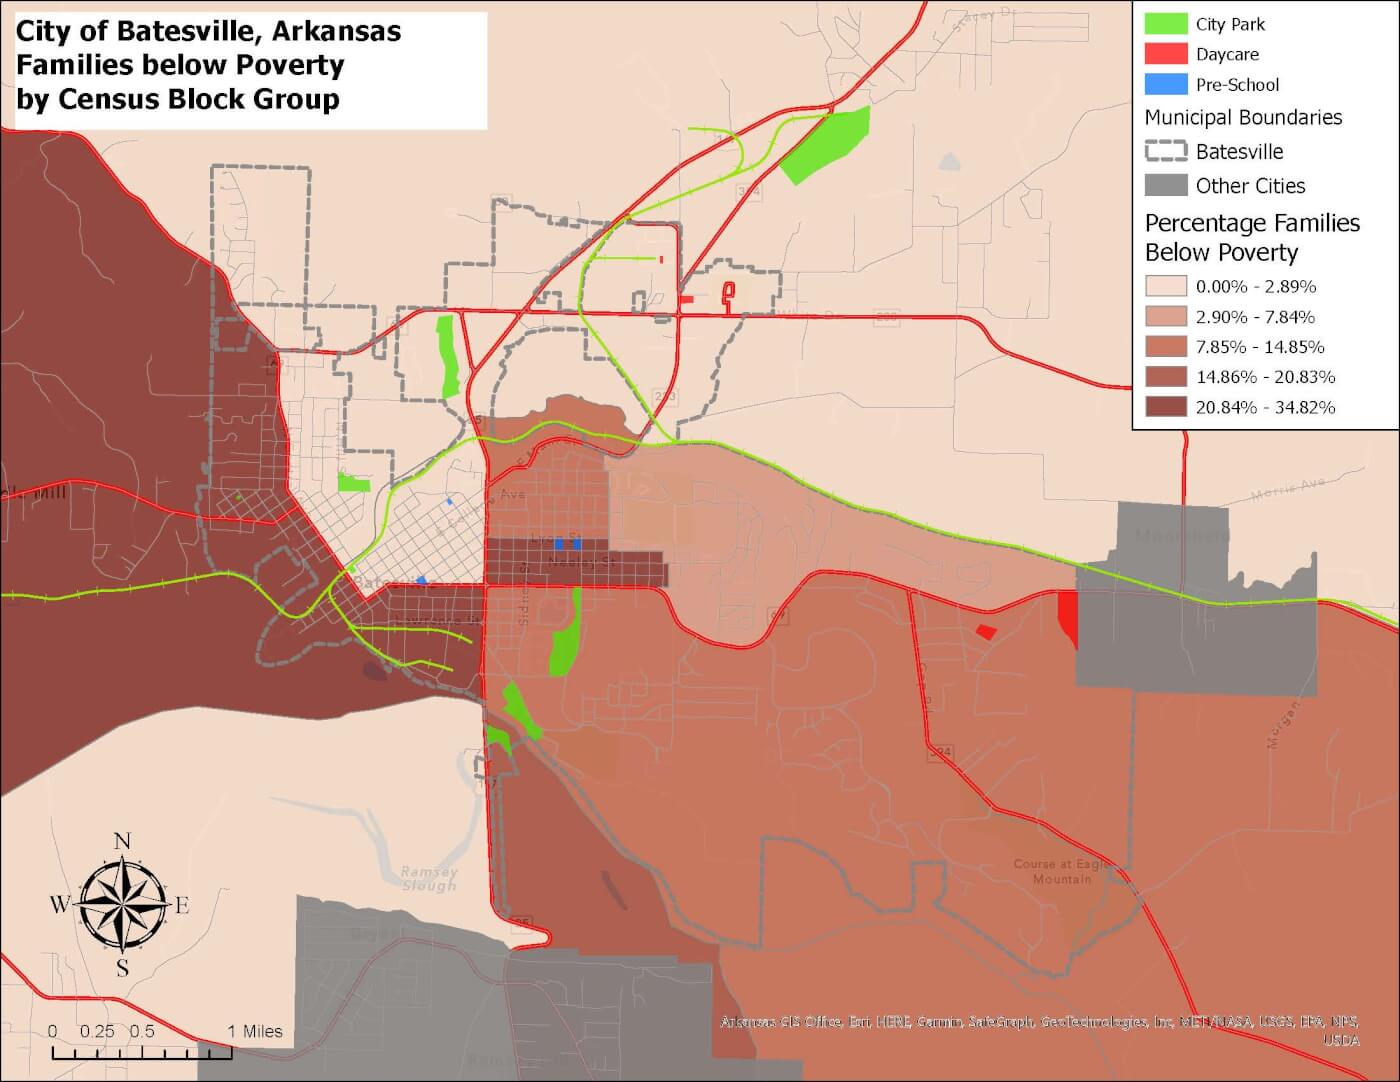
Families Below Poverty
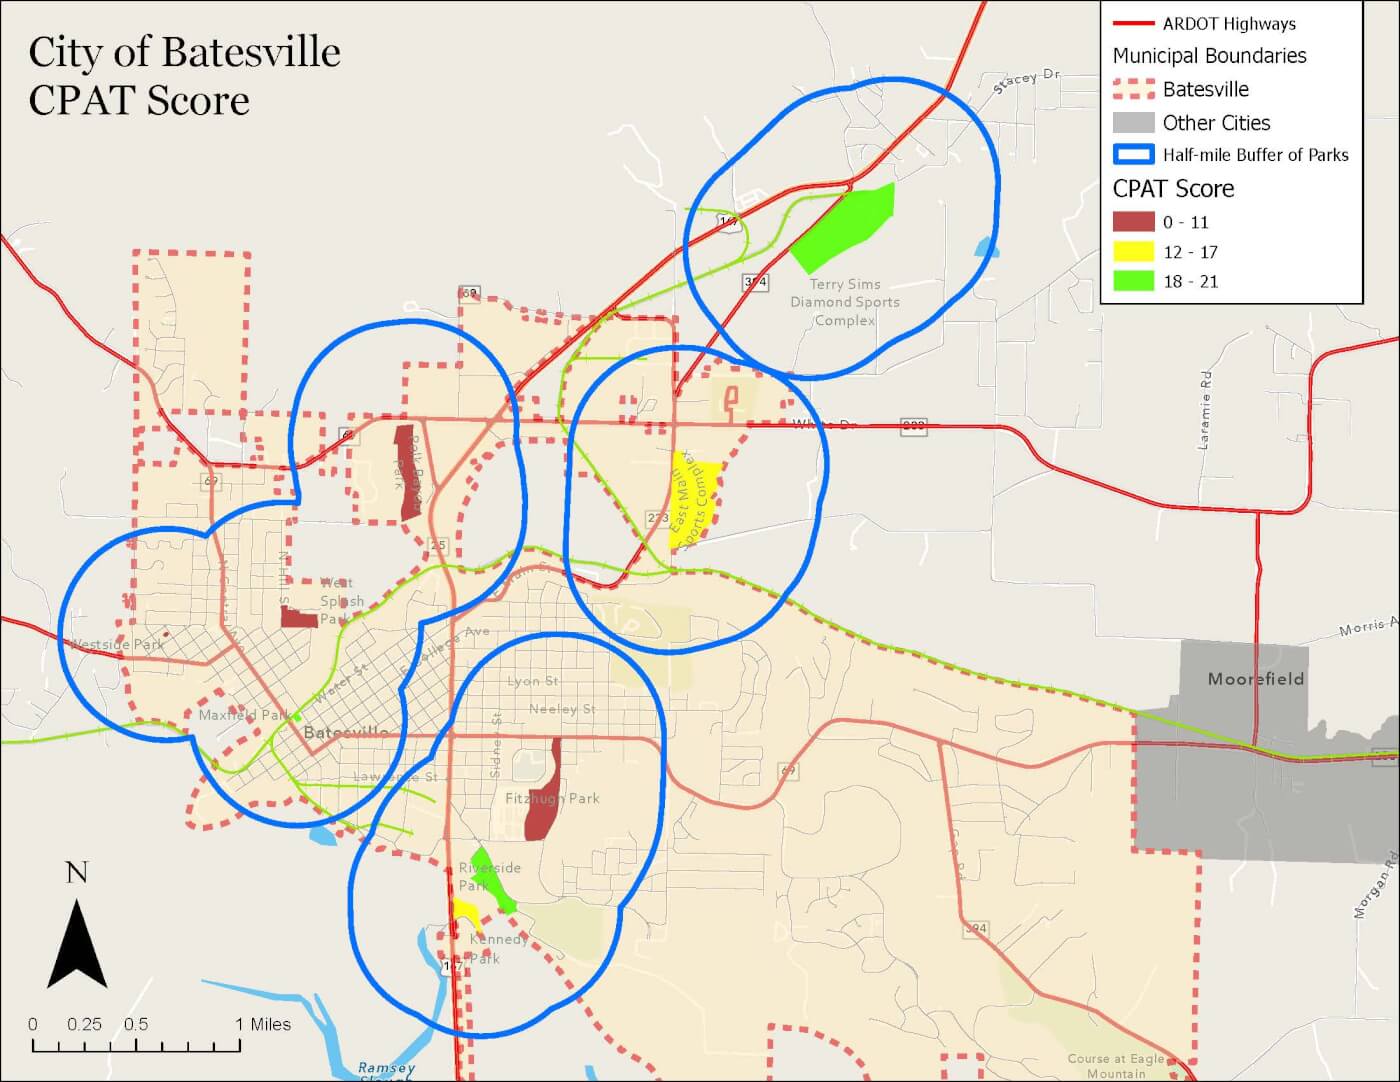
Community Parks Audit (CPAT) Scores Represented
Batesville, Arkansas
Population: 11,191
Lead Partners: Batesville Parks and Recreation Department, Batesville Area Chamber of Commerce and Batesville Preschool
Goal of Mapping:
Create an interactive mapping platform with up-to-date data to identify areas where vulnerable young children have inequitable access to quality parks.
How the Project will Inform Policy and Funding Decisions:
The city team will use the platform to showcase needs and work with the City to prioritize funding and programming. The city is refinancing a bond worth $20-25 million that offers the opportunity for some capital improvements to parks that will better serve young children and their families. The mapping will help to support the prioritization of where to invest in new green spaces and where improvements to existing spaces are needed.
Since joining CCCN, the Parks department now requires RFPs for natural playscapes to include early childhood amenities (using CCCN benefits language) and parks development now includes a family and caregiver engagement process.
Steps to Success:
The City Parks and Recreation Department used a $10,000 CCCN grant to hire a GIS contractor to compile data and develop static maps that show where young children in the city live and spend time, their characteristics/needs, and available green and natural spaces.
The team used 2020 Census Block Data including child care center location, population of children under five, households living in poverty, and households with children under 18 with no vehicle available.
The city mapped green spaces such as parks, and conducted park observations using the Community Park Audit Tool (CPAT). The park audit created a ranking of priority green spaces.
The city created static maps for internal planning. They are building a story map with interactive content that informs, inspires and engages stakeholders publicly.
The city next plans to create a platform to share green space and park amenities for the public.
Map 1: Children Under 5 – Batesville Arkansas
Map 2: Families Below Poverty – Batesville Arkansas
Map 3: Community Parks Audit (CPAT) Scores Represented
Boulder, Colorado
Population: 102,034
Lead Partners: Boulder Parks and Recreation Department, Boulder Open Space and Mountain Parks Department
Goal of Mapping:
Boulder Parks and Recreation and Open Space and Mountain Parks developed a GIS tool that includes up-to-date data to identify areas where young children across the city have access to the outdoors and nature as well as a focus on vulnerable children who have inequitable access to green space.
How the Project will Inform Policy and Funding Decisions:
The City has developed a data dictionary, analysis, and dashboard tool and plans a number of local next steps:
- Data findings will inform the backbone of the plan the City and Growing Up Boulder (GUB) are creating through participation in UNICEF’s Child Friendly Cities Initiative.
- Inform capital investment program (CIP) for youth investment for the Boulder Youth Nature Initiative (BYNI),
- Improve mapping to better inform how we create sites for youth through place-making and space activation
Steps to Success:
The city’s project included several components. The team worked with City GIS staff to create several tools:
- GIS tool to understand access to the outdoors for children under 5. Using CCCN resources, developing this tool involved:
-
- Collating and updating city data about parks, open spaces, school grounds, play areas, natural areas, creeks, lakes, and water features within Boulder.
- Combining these city data sets with child-friendly outdoor places identified by more than 700 young people who worked with Growing Up Boulder in 2019 to develop a child-friendly map of Boulder.
- Partnering with city Transportation staff to understand how easily children under 5 and their caregivers can walk or roll to a range of these green and blue spaces. Based on a community-informed methodology of defining 15-minute neighborhoods, this analysis applied the concept that 10 minutes is a more meaningful measure of easy, multimodal access for young children, including those experiencing disabilities.
- Overlaying this walkshed analysis with census data showing the density of city residents under 5 by census block group. The layered approach helped city staff determine areas with limited access to green and blue spaces for young children.
2. GIS tool to identify geographic priority areas for youth equity, at a finer scale than U.S. Census Data. Using CCCN resources, developing this tool involved:
- Using recently released census data to understand where more children and youth are living across the city (0-5, 6-12, 13-16, and 17-18) by block group.
- Overlaying that with the following Census data:
- Percentage of the block group population that are Black, Indigenous, and People of Color (BIPOC), and youth experiencing disability
- Median income by block group
- Percentage of the block group population living below the poverty line
- Adding local city data on the percentage of the block group population receiving financial aid through the City of Boulder’s Housing and Human Services (HHS) aid programs
3. Additionally, the team is in the process of creating a new process called ‘Emotion by Design,’ which applies these GIS tools to understand and enhance the ways access to green and blue spaces can improve mental health and well-being for all youth across the City with a focus on minoritized children and youth. Specifically, this approach seeks to identify which emotions children have in response to certain outdoor activities in specific landscape types. By understanding these emotional responses, and by making them apparent to children and their caregivers, the Boulder team hopes to:
- bring more awareness of the mental health benefits of being outside.
- enhance outdoor spaces with natural and built amenities that engender positive emotions.
- Activate outdoor spaces with programs and activities that foster belonging and well-being for children and families.
In Fall 2023, the Boulder team will implement and test a methodology for Emotion by Design to map which children’s activities happen where and the associated emotional responses. This process will then inform park place-making (design) and space-making (programming)through Boulder’s Capital Investment program. For example, the city will invest in improvements more likely to engender positive emotions for Boulder’s minoritized children and youth.
San Francisco, CA
Population: 808,437
Lead Partners: The San Francisco Children & Nature Collaborative includes over 30 government and community organizations. It is jointly supported by SF Recreation & Parks, the Presidio Trust, YMCA-SF, California Academy of Science, and the Department of Early Childhood.
Goal of Mapping:
San Francisco Children & Nature addresses equity by prioritizing programming, placemaking projects, resources and investments in the City’s most disadvantaged communities.
Steps to Success:
In 2017, SF Children & Nature adopted the SF Recreation and Parks Department’s Equity Zones after analyzing equity metrics from various city agencies.
In 2023, SF Children & Nature shifted to using Environmental Justice (EL) Communities in low-income areas and communities of color with a disproportionate burden of environmental hazards.
The EJ Communities Map, developed by the SF Planning Department, is based on CalEnviroScreen, a tool created by CalEPA& OEHHA that maps California communities that are most affected by pollution and other health risks. It includes additional local data on pollution and demographics and has been refined during the community engagement process based on public feedback.
To identify inequities and barriers to nature connection in early childhood, SF Children & Nature partnered in 2017 with Education Outside to conduct a survey of early childhood programs, including centers and family children care homes, to determine program location, the outdoor quality of program outdoor spaces, use of field trips, and barriers to nature-based learning.
- City of Atlanta, Parks and Recreation Department, Equity Data Tool. Methodology Report
- CDC, Tobacco Where You Live: Mapping Techniques
- Children & Nature Network, Finding Nature News, Using a data-driven approach to invest in Atlanta’s children
- San Francisco Children and Nature, Google My Map Early Childhood Education Outdoor Play Space maps
- ArcGIS StoryMaps
Cities Connecting Children to Nature (CCCN) Newsletter
Stay on top the news, resources and research for city and community leaders working to increase equitable access to nature.
SubscribeThe CCCN initiative is supported by:
DONATE TODAY TO BECOME A MEMBER
Help us make sure that all children live, learn and grow with nature in their daily lives.